
- Short date
- Currency

- Scientific
- Text
- Adventure Works’ data storage costs may increase.
- Adventure Works’ data infrastructure could be compromised.
- Adventure Works will have to put the product launch on hold.
- Adventure Works could make poor decisions related to the product launch.

- Copy the Product Description from a similar product.
- Leave the missing entries unchanged.
- Use the last updated Product Description to fill in the missing entry.
- Remove the rows with missing entries for the Product Description.

- Order Date

- Customer ID
- Product Weight
- Payment Method
- Order details
- Supply chain data
- Website analytics
- Feedback data

- Your main role as a data analyst is to create a data model representing the structure and relationships of the data.
- Your main role as a data analyst is to conduct market research and develop social media strategies and campaigns.
- Your main role as a data analyst is to manage Adventure Works’ IT infrastructure and data security.
- Your main role as a data analyst is to collect, organize, and analyze data to generate insights.

- Ensure your data reports are secure and accessible only to authorized users
- Ensure accessibility and device compatibility for your data reports
- Regularly consider data storage and refresh schedules for your data reports
- Consider the design and visual appeal of your data report, including color schemes and fonts
- Data is collected, cleaned, processed, and interpreted to extract insights and inform decisions.

- Data is solely used for troubleshooting technical issues.
- Data is primarily used to test the functionality of data analysis software.
- Data provides a basis for the company’s annual reports.
- Using statistical analysis software
- Awareness of impact

- Strategic thinking

- Understanding of context


- Communicating with stakeholders to identify their needs and preferences in relation to the data analysis.
- Navigating sensitive situations related to data analysis and maintaining positive relationships with stakeholders.

- Proficiency in explaining advanced predictive modeling and data visualization techniques to stakeholders.
- Mediating disagreements among stakeholders related to data interpretation or decision-making.

- By learning more programming languages to cater to different business problems.
- By attending more technical workshops.
- By asking questions, empathizing with the users’ perspectives, and collaborating with stakeholders.

- By reading more data analysis and business books.
- By converting raw data into visually appealing and intricate charts and diagrams.
- By retaining control of all data tasks, reducing the need for others to understand complex concepts.
- By explaining data insights in a simple, understandable way to aid communication.

- By understanding the specific jargon and technical language of each department.
- Gathering, cleaning, and pre-processing raw data to make it suitable for analysis.
- Digging deep into data to uncover insights and answer specific questions.
- Creating a data model that represents the structure and relationships of the data.
- Identifying inconsistencies and errors in the data.

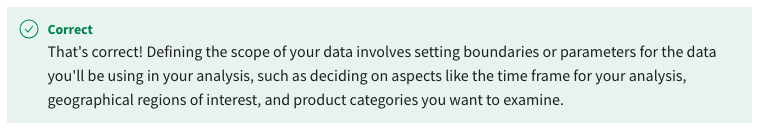
- Determining the time frame for your analysis.
- Deciding on the geographical regions you are interested in.

- Selecting the product categories you want to include.

- Identifying the type of data to be collected.
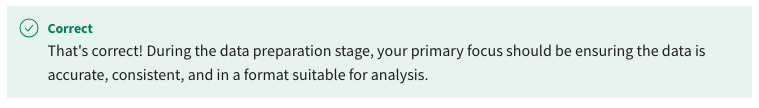
- Making sure that the data is consistent.

- Identifying the sources of data.
- Ensuring that the data is accurate.

- Getting the data ready for analysis.

- Consolidating data from multiple sources into a single source for easy access.
- Performing complex calculations on the data.
- Loading the transformed data into a suitable storage space.

- Transforming raw data into a structured format suitable for analysis.

- Data visualization can help support gathering manufacturing data from various sources, ensuring comprehensive understanding.
- Data visualization can replace the need to analyze manufacturing data, improving efficiency.
- Data visualization can validate the accuracy of the manufacturing data and the reliability of the analysis.
- Data visualization can help make the manufacturing data more accessible to stakeholders and easier to understand.
- It assists in gathering more data for future analysis, ensuring a more comprehensive range of insights.
- It assists in determining the appropriate file formats for sharing visualizations.
- It helps create effective visualizations leading to better decision-making.
- It helps to identify optimal color schemes and font styles to use in the visualizations.
- To forecast future sales trends based on historical data.
- To automate the data collection process from various sources.
- To create a detailed data model of the entire company operations.
- To clean, transform, and reshape data for analysis.

- SQL
- R
- Python
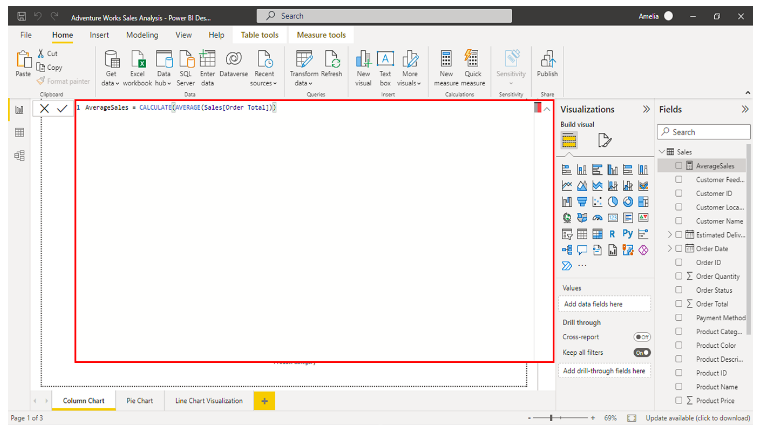
- Data Analysis Expressions (DAX)

- Data stored in a software platform, such as an Enterprise Resource Planning (ERP) system.
- Data collected from automatic door sensors.

- Data from customer feedback forms.

- Images and videos coming from social media.
- Power BI Apps

- Power BI Connectors
- Power BI Report Server
- Power BI Embedded
- Apply different user permission levels to your dashboards to manage access data access.

- Share your data with relevant stakeholders to promote collaboration.

- Analyze and present your data using various visualizations and charts.
- Use Power BI Mobile apps to view and interact with the report and dashboards.

- Stakeholders’ technical expertise determines which data sources you should use for the visualizations included in the dashboard.
- Stakeholders’ technical expertise influences the complexity and depth of the visualizations.
- Stakeholders’ technical expertise primarily guides the theme choices for the dashboard, ensuring visual appeal.

- Stakeholders’ technical expertise limits the choice of visualizations to simple charts.
- It processes data for storage in a database.
- It can enhance operational efficiency and reduce manual labor.

- It allows for the ingestion of structured data.
- It decreases the variety of data types that can be ingested.
- It does not allow for the ingestion of structured data.
- It is time-consuming and prone to errors.

- It is unsuitable for large-scale data ingestion.

- It requires specialized tools and infrastructure to handle the continuous flow of data.
- Prioritizing real-time data ingestion over batch processing.
- Ensuring the transformed data is consistent, accurate, and complete.
- Implementing machine learning models for predictive analysis.
- Organizing file structure for data accessibility.
- Its ability to provide remote access to data.
- Its ability to integrate new data sources.
- Its ability to handle changes in data volume.

- Its ability to store data in different formats.
- It ensures that future analyses have a clean and consistent foundation.

- It changes the data format to make it more suitable for analysis.
- It facilitates duplicate data entries in the analysis.
- It allows for transforming data within the Microsoft Power BI environment.
- To extract specific parts of text from a cell.
- To find and retrieve data from other parts of the worksheet.
- To apply different formats to cells based on specific conditions.
- To set criteria for the allowable data in a cell or range of cells.

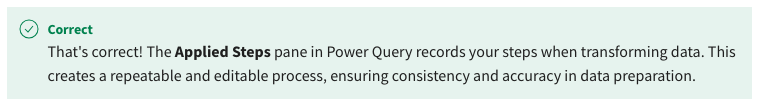
- To record the transformation steps in data preparation.

- To clean, reshape, and transform data into a structured, usable format.
- To connect various data sources and select specific datasets or tables.
- To show the history of actions performed on the dataset.

- To facilitate real-time collaboration with team members.
- To create meaningful and impactful data visualizations.
- To automate the process of data entry.
- To convert raw data into a more meaningful and usable format.

- Refining and correcting your data in the original source before importing it into a tool for further analysis or visualization.

- Evaluating your Power BI reports and identifying and addressing any errors, such as inconsistencies in the data visualizations.
- Checking data consistency and removing duplicates at the source before importing it to Power BI.

- Importing data in Power BI for visualization by retrieving and integrating data from multiple sources.
- To ensure users always work with up-to-date information.
- To make the reports look more professional.
- To reduce the amount of data stored.
- To prevent unauthorized access to the data.
- Data is collected, cleaned, processed, and interpreted to extract insights and inform decisions.

- Data provides a basis for the company’s annual reports.

- Data is primarily used to test the functionality of data analysis software.
- Data is solely used for troubleshooting technical issues.
- Data visualization
- Strategic thinking
- Data wrangling
- Using statistical analysis software
- To stream data in real time, enabling immediate data processing and analysis.
- To create visually appealing and interactive data visualizations for analysis reports.
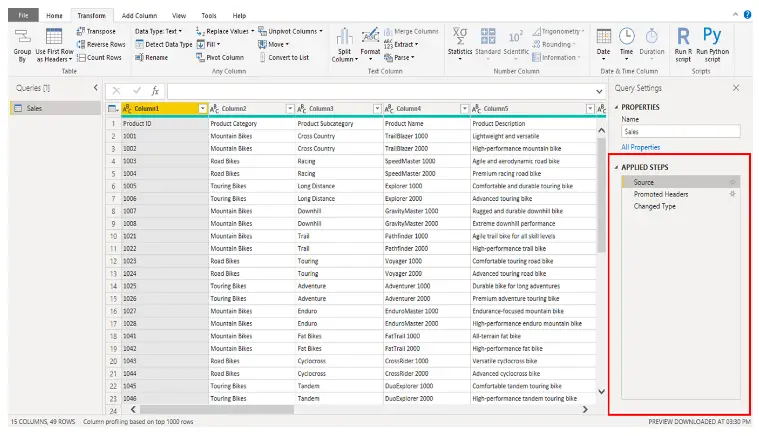
- To connect to data sources, clean and transform data, and load it into Microsoft Power BI.
- To create comprehensive business reports with insights for data-driven decision-making.
- Conduct competitive market research to gain insights into potential business opportunities.
- Coordinate with the sales team to implement new sales strategies based on data insights.
- Liaise with vendors and negotiate the purchase of new hardware and software.
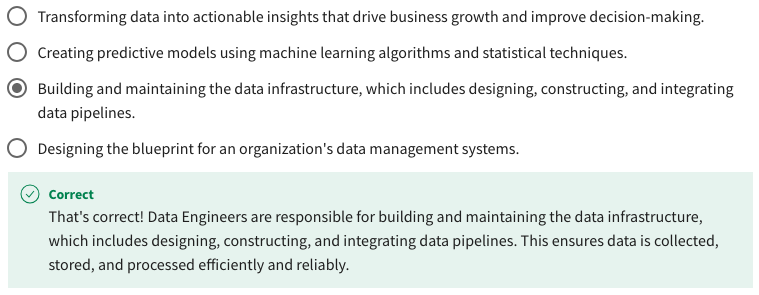
- Design, construct, and maintain the data infrastructure.
- Modify your data analysis results to align with the preferences of each stakeholder.
- Take charge of all business operations influenced by your data insights.
- Managing disagreements and maintaining trust and respect even when presenting challenging results.

- Generate multiple versions of your analysis to accommodate stakeholder perspectives.
- Asking questions, empathizing with the users’ perspectives, and collaborating with stakeholders.

- Learning more programming languages to cater to different business problems.
- Attending more technical workshops.
- Frequently engaging with users to get feedback on the data analysis results.

- Skill in translating raw data into visual graphs.
- The ability to translate complex concepts into easily understandable terms.

- The ability to work with multiple programming languages.
- Competence in translating foreign languages.
- To transform raw data into a structured format suitable for analysis.

- To perform complex calculations on the data.
- To consolidate data from multiple sources into a single source for easy access.
- To create visualizations of the data.
- It helps in extracting data from various sources.
- It helps make complex data more accessible and easier to understand.
- It ensures the accuracy of the data.
- It replaces the need for complex calculations.
- It helps create effective visualizations that lead to better decision-making.

- It can help by increasing collaboration and leading to improved business outcomes.

- It reduces the time required for visualization design.
- It is necessary for compliance with data regulations.

- It allows you to share and collaborate on reports and dashboards.
- It allows you to clean, transform, and reshape data.

- It allows you to filter data at various levels.
- It allows you to visualize data with bar charts and maps.
- Data Analysis Expressions (DAX)

- R

- SQL
- Python

- Structured data
- Unstructured data
- Semi-structured data

- Transformed data
- It influences the complexity and depth of the visualizations.

- It determines the color scheme of the visualizations.
- It determines the aesthetics and formatting of the visualizations.
- It helps in deciding the number of visualizations to be created.
- It requires specialized tools and infrastructure to handle the continuous flow of data.
- It can only be used with databases or data warehouses.
- It does not allow for the ingestion of structured data.
- It is time-consuming and prone to errors.

- Organizing file structure for data accessibility.
- Ensuring the transformed data is consistent, accurate, and complete.

- Ensuring data is accessible for legal purposes.
- Cleaning the extracted data.

- The ability to securely store data for legal purposes.
- The ability to handle increased or decreased data volume as the organization grows.

- The ability to maintain performance levels with increasing data loads.
- The ability to provide remote access to data.
- It ensures that future analyses have a clean and consistent foundation.
- It reduces the likelihood of inconsistencies and errors in the data.

- It allows for data transformation within the Microsoft Power BI environment.
- It facilitates duplicate data entries in the analysis.
- To record the transformation steps in data preparation.

- To provide a list of data sources.
- To display the final data visualization.
- To perform mathematical calculations on data.
- To convert raw data into a more meaningful and usable format

- To perform mathematical calculations on data.
- To reduce the size of the data set.
- To improve data quality and consistency.

- To understand the context in which you are working, including the industry, market trends, and company goals

- To collect data from multiple sources and organize the data in preparation for analysis

- To analyze customer behavior and identify trends that can inform marketing campaigns

- To implement marketing and social media engagement strategies to improve sales
- To connect to data sources, clean and transform data, and load it into Microsoft Power BI.

- To stream data in real time, enabling immediate data processing and analysis.
- To create visually appealing and interactive data visualizations for analysis reports.
- To automate data preparation tasks, such as data extraction, cleaning, merging, and transformation.

- Start the process of cleaning and preparing the data for data analysis.
- Include as many data sources and datasets in your analysis as possible to ensure comprehensive insights.
- Define the years, geographical regions, and product categories to include in the analysis.
- Identify the data type to be collected and extract the data from the relevant sources.
- Ensuring the data is accurate, consistent, and ready for analysis.
- Sharing the raw data with the stakeholders for their input.
- Identifying any insights or trends in the data.
- Conducting a preliminary data analysis to get a general overview.
- To transform the raw manufacturing data into a structured format suitable for analysis and load it into a suitable storage space.

- To encrypt the manufacturing data to ensure privacy and security.
- To conduct a preliminary analysis of the manufacturing data.
- To consolidate all the manufacturing data into a single file for easy access.
- It allows you to merge and append queries.

- It permits you to visualize data using bar charts and maps.
- It enables you to clean, transform, and reshape data.

- It provides a platform to share and collaborate on reports and dashboards.
- Power BI Apps

- Power BI service

- Power BI Connectors
- Power BI Desktop
- It influences the complexity and depth of the visualizations.

- It determines the color scheme of the visualizations.
- It guides the choice of appropriate visualization tools and techniques.

- It helps in deciding how many visualizations to create.
- Excel data validation rules make linking cells across different worksheets easier.
- Data validation rules in Excel help automate the calculation process.
- Data validation rules in Excel allow you to set criteria for the allowable data in a cell or range of cells.

- Data validation rules in Excel enable real-time collaboration.
- It provides a list of data sources.
- It records the transformation steps in data preparation.
- To show the history of actions performed on the dataset.

- It displays the final data visualization.