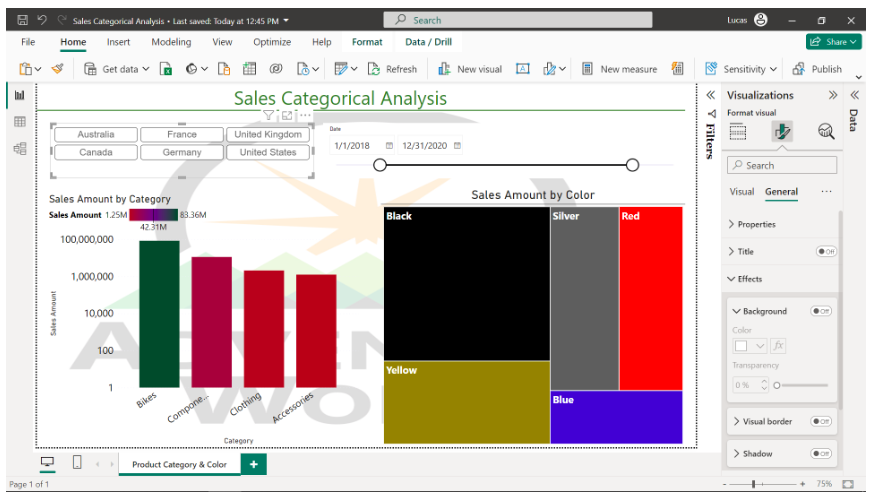
microsoft pl-300 exam preparation and practice coursera week 3 answers

Self-review: What did you learn?

In the formatting and configuring visualization activities you visually enhanced a report with Conditional Formatting, Report Page Settings and a Custom Visualization.

A screenshot of the results is included for reference:

Now it’s time to review your understanding of the tasks you complete by answering the following questions. Don’t forget that you can refer to previous lesson items to recap your process steps.

1. Which of the following visualizations would be the most appropriate for a categorical analysis of a field with more than 10 separate values?

  • Pie chart
  • Column chart

  • Scatter plot.

2. Within which formatting category would a user adjust the title of a visualization?

  • Visual
  • General
  • Conditional formatting

3. Which of the following conditional formatting settings was used to apply the color hex codes to the visualization?

  • Gradient
  • Field value

  • Rules

4. Which of the following filtering options offers the capability to apply a filter to all pages of the report?

  • Filters pane

  • Visualization settings
  • Slicer

5. What is the function of the Lock button in the Filters pane filters?

  • Locks the filter pane adjustments to users
  • Hides the filter from users
  • Disables the modification of the filter

6. True or False:The default option of a 16:9 ratio in the report page allows users to specifically adjust the number of pixels of the page’s width and height.

  • True
  • False

7. Which of the following settings can be found in the Report page settings? Select all that apply.

  • Visual border
  • Tooltips
  • Wallpaper

  • Filters pane

8. True or False: Custom apps in Power BI do not share the default visualization settings as native Power BI Visualizations.

  • True
  • False

In the Enhance reports for usability and storytelling activity you visually enhanced a report with Conditional formatting, Report page settings and a Custom visualization.

A screenshot of the results is included for reference:

Now it’s time to review your understanding of the tasks you completed by answering the following questions.

9. In the activity, how did bookmarks assist you in creating a Power BI presentation of the sales benchmarks for Europe in 2019?

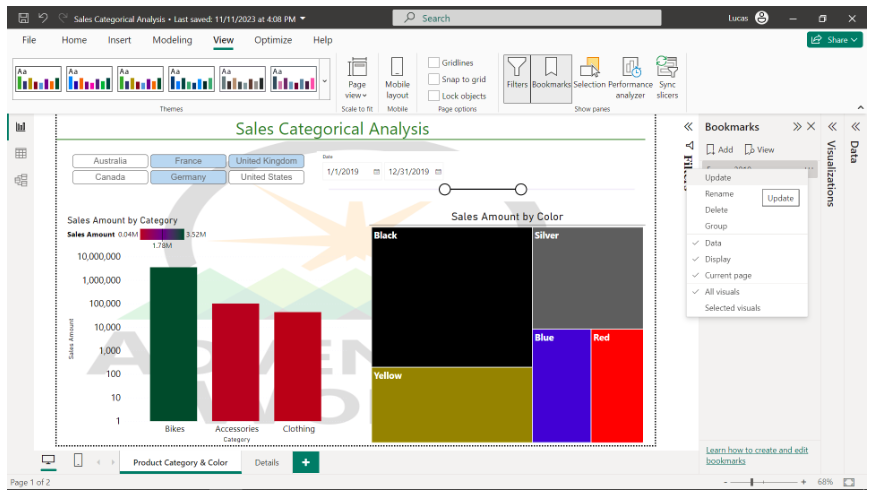
  • Bookmarks saved the relevant filtered state of the report.

  • Bookmarks filtered the dataset to contain only relevant data.
  • Bookmarks increased the report loading speed.

10. What information is contained in a bookmark? Select all that apply.

  • Visualization visibility

  • Graph position
  • Slicer filters

  • Color Theme

11. How was Adventure Works able to incorporate a Visualization within another Visualization's Tooltip?

  • Assigned a report page Tooltip.

  • Changed the Tooltip settings to “Visualization”.
  • Modified the Tooltip to custom by adding additional fields.

12. What is the effect on the default Tooltip fields when new fields are added to a tooltip?

  • They are still visible together with the added fields.

  • They are aggregated in a single field.
  • They are replaced by the added fields.

13. True or False: When you re-launch a published Power BI Report, the sorting previously applied in a published Power BI Report gets reapplied.

  • True
  • False

14. How can a text field, such as a Month name field, be sorted chronologically instead of alphabetically?

  • Sorting the field by another column.

  • Applied two-column sorting on the visualization.
  • Adjusting the sorting method from the visualization’s settings.

15. Which of the following design methods are effective when optimizing a Power BI report for mobile use?

  • Utilize simple and focused visualizations.

  • Using text annotations to explain data points.
  • Designing the report on horizontal layout.
  • Creation of a separate layout in Mobile Layout view.

16. What is the primary function of the Analyze feature in Microsoft Power BI when examining data trends?

  • To create complex DAX formulas
  • To import new datasets into Power BI
  • To highlight trends and patterns in your data

  • To modify data source settings

17. The data analysis team at Adventure Works receives a dataset detailing sales figures across various countries. However, the stakeholders are interested in a broader view of the sales performance. They want to see the sales figures aggregated by continents rather than individual countries. How can the data analysis team solve this problem?

  • By data binning
  • By data grouping

  • Requesting the team to recreate the dataset with continents
  • Using treemaps

18. The data analysis team at Adventure Works is analyzing recent data relating to bicycle sales data. They are focusing on varying sale prices. The marketing team has requested that this price data be organized into value categories so that they target different customer segments effectively.

Which method should the data analysis team use to categorize continuous sale price data for this targeted campaign planning?

  • Data binning

  • Time series analysis
  • Data grouping
  • Cluster analysis

19. True or False: You can create a new group on any field in the data pane or in a field well.

  • True
  • False

20. Which of the following statements is true about data grouping?

  • Data grouping is only useful for text columns.
  • Data grouping allows you to combine data rows based on specific column values.

  • Data grouping creates new fields for each group.
  • Data grouping is primarily used for creating visualizations.

Leave a Reply