
unsupervised learning recommenders reinforcement learning coursera week 1 answers
Clustering
1. Which of these best describes unsupervised learning?
- A form of machine learning that finds patterns without using a cost function.
- A form of machine learning that finds patterns using unlabeled data (x).
- A form of machine learning that finds patterns using labeled data (x, y)
- A form of machine learning that finds patterns in data using only labels (y) but without any inputs (x) .
2. Which of these statements are true about K-means? Check all that apply.
- The number of cluster assignment variables c(i) is equal to the number of training examples.
- The number of cluster centroids μk is equal to the number of examples.
- If you are running K-means with K=3 clusters, then each c(i) should be 1, 2, or 3.
- If each example x is a vector of 5 numbers, then each cluster centroid μk is also going to be a vector of 5 numbers.
3. You run K-means 100 times with different initializations. How should you pick from the 100 resulting solutions?
- Pick randomly — that was the point of random initialization.
- Pick the last one (i.e., the 100th random initialization) because K-means always improves over time
- Pick the one with the lowest cost J
- Average all 100 solutions together.
4. You run K-means and compute the value of the cost function J(c (1) ,…,c (m) ,μ 1 ,…,μ K ) after each iteration. Which of these statements should be true?
- The cost will either decrease or stay the same after each iteration. .
- The cost can be greater or smaller than the cost in the previous iteration, but it decreases in the long run.
- There is no cost function for the K-means algorithm.
- Because K-means tries to maximize cost, the cost is always greater than or equal to the cost in the previous iteration.
5. In K-means, the elbow method is a method to
- Choose the best random initialization
- Choose the maximum number of examples for each cluster
- Choose the best number of samples in the dataset
- Choose the number of clusters K
Anomaly detection
6. You are building a system to detect if computers in a data center are malfunctioning. You have 10,000 data points of computers functioning well, and no data from computers malfunctioning. What type of algorithm should you use?
- Anomaly detection
- Supervised learning
7. You are building a system to detect if computers in a data center are malfunctioning. You have 10,000 data points of computers functioning well, and 10,000 data points of computers malfunctioning. What type of algorithm should you use?
- Anomaly detection
- Supervised learning
8. Say you have 5,000 examples of normal airplane engines, and 15 examples of anomalous engines. How would you use the 15 examples of anomalous engines to evaluate your anomaly detection algorithm?
- You cannot evaluate an anomaly detection algorithm because it is an unsupervised learning algorithm.
- Use it during training by fitting one Gaussian model to the normal engines, and a different Gaussian model to the anomalous engines.
- Put the data of anomalous engines (together with some normal engines) in the cross-validation and/or test sets to measure if the learned model can correctly detect anomalous engines.
- Because you have data of both normal and anomalous engines, don’t use anomaly detection. Use supervised learning instead.
9. Anomaly detection flags a new input x as an anomaly if P(x)<ϵ. If we reduce the value of ϵ, what happens?
- The algorithm is more likely to classify new examples as an anomaly.
- The algorithm is less likely to classify new examples as an anomaly.
- The algorithm is more likely to classify some examples as an anomaly, and less likely to classify some examples as an anomaly. It depends on the example x.
- The algorithm will automatically choose parameters μ and σ to decrease p(x) and compensate.
10. You are monitoring the temperature and vibration intensity on newly manufactured aircraft engines. You have measured 100 engines and fit the Gaussian model described in the video lectures to the data. The 100 examples and the resulting distributions are shown in the figure below.
The measurements on the latest engine you are testing have a temperature of 17.5 and a vibration intensity of 48. These are shown in magenta on the figure below. What is the probability of an engine having these two measurements?
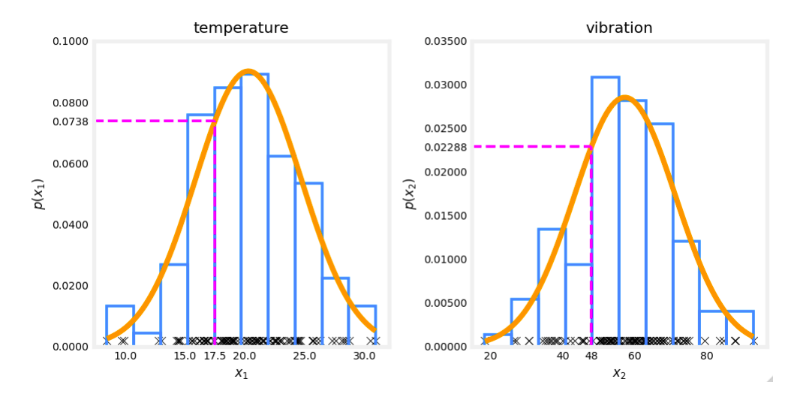
- 0.0738 + 0.02288 = 0.0966
- 17.5 + 48 = 65.5
- 17.5 * 48 = 840
- 0.0738 * 0.02288 = 0.00169