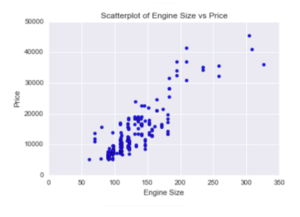
data analysis with python coursera week 3 quiz answers Practice Quiz: Descriptive Statistics 1. What plot would you see after running the following lines of code?x=df[“engine-size”]y=df[“price”]plt.scatter(x,y)plt.title(“Scatterplot of Engine Size vs Price”)plt.xlabel(“Engine Size”) plt.ylabel(“Price”) Answers Practice Quiz: GroupBy in Python 2. Select the appropriate description of a pivot table: Answers A pivot table has one variable displayed along the columns and the other variable displayed along the rows.A pivot table contains statistical information for each column Correlation 3. Select the scatter plot with weak correlation: Answers Practice Quiz: Correlation - Statistics 4. Consider the following scatter plots a,b and c. What plot would have the highest correlation coefficient? (Note: this one is harder than it seems) Answers abcthey all have the same value Graded Quiz: Exploratory Data Analysis 5. Consider the dataframe df; what method provides the summary statistics? Answers describe()head()tail() 6. What is the largest possible element resulting in the operation df.corr()? Answers 10010001 7. If the p-value of the Pearson Correlation is 1, then ... Answers The variables are correlatedThe variables are not correlatedNone of the above 8. Consider the dataframe df;what method displays the first five rows of a dataframe? Answers df.describe()df.head()df.tail() 9. What is the Pearson Correlation between variables X and Y, if X=-Y? Answers -1 10 Share the love Share this content Opens in a new window Opens in a new window Opens in a new window Opens in a new window Opens in a new window Opens in a new window Opens in a new window You Might Also Like Course 5: Document Design Module 1: Review of Cloud Support Topics using python to access web data coursera answers Leave a Reply Cancel replyCommentEnter your name or username to comment Enter your email address to comment Enter your website URL (optional) Save my name, email, and website in this browser for the next time I comment.