data analysis with python coursera week 5 quiz answers
Practice Quiz: Model Evaluation
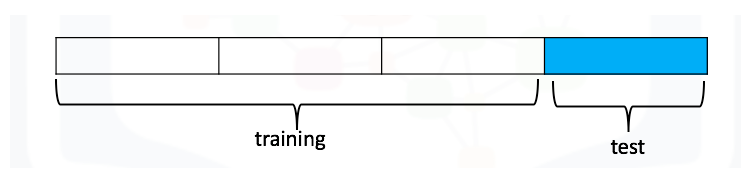
1. What is the correct use of the "train_test_split" function such that 90% of the data samples will be utilized for training, the parameter "random_state" is set to zero, and the input variables for the features and targets are x_data, y_data respectively.
Practice Quiz: Overfitting, Underfitting and Model Selection
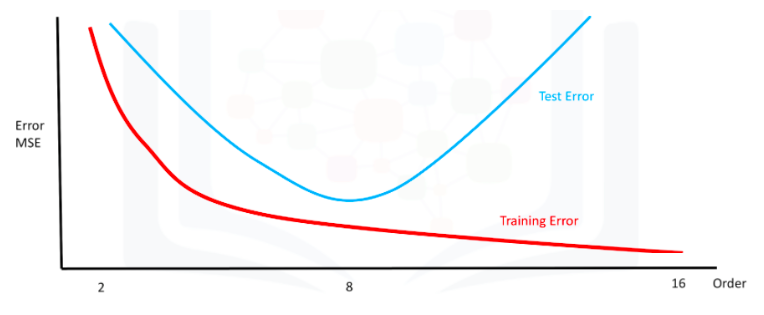
2. In the following plot, the vertical axis shows the mean square error and the horizontal axis represents the order of the polynomial. The red line represents the training error the blue line is the test error. Should you select the 16 order polynomial.
The predicted values of the test data using cross-validation
The average R^2 on the test data for each of the two folds
This function finds the free parameter alpha
5. What dictionary value would we use to perform a grid search to determine if normalization should be used and for testing the following values of alpha? 1,10, 100
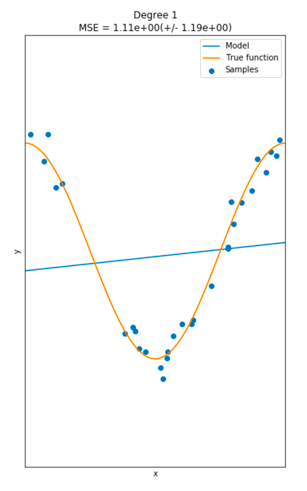
6. You have a linear model; the average R^2 value on your training data is 0.5, you perform a 100th order polynomial transform on your data then use these values to train another model. After this step, your average R^2 is 0.99; which of the following comments is correct?