
Week 3: Working with data in R
1. A data analyst is working with a dataset in R that has more than 50,000 observations. Why might they choose to use a tibble instead of the standard data frame? Select all that apply.
- Tibbles can create row names
- Tibbles automatically only preview the first 10 rows of data
- Tibbles can automatically change the names of variables
- Tibbles automatically only preview as many columns as fit on screen
2.A data analyst is exploring their data to get more familiar with it. They want a preview of just the first six rows to get a better idea of how the data frame is laid out. What function should they use?
- print()
- preview()
- head()
- colnames()
3. You are working with the ToothGrowth dataset. You want to use the head() function to get a preview of the dataset. Write the code chunk that will give you this preview.

What are the names of the columns in the ToothGrowth dataset?
- VC, supp, dose
- len, supp, dose
- len, supp, VC
- len, VC, dose
4. A data analyst is working with a data frame named sales. They write the following code:
sales %>%
The data frame contains a column named q1_sales. What code chunk does the analyst add to change the name of the column from q1_sales to quarter1_sales ?
- rename(quarter1_sales = q1_sales)
- rename(q1_sales <- “quarter1_sales”)
- rename(quarter1_sales <- “q1_sales”)
- rename(q1_sales = quarter1_sales)
5. A data analyst is working with the penguins data. They write the following code:
penguins %>%
The variable species includes three penguin species: Adelie, Chinstrap, and Gentoo. What code chunk does the analyst add to create a data frame that only includes the Gentoo species?
- filter(species == “Gentoo”)
- filter(species <- “Gentoo”)
- filter(Gentoo == species)
- filter(species == “Adelie”)
6. You are working with the penguins dataset. You want to use the summarize() and max() functions to find the maximum value for the variable flipper_length_mm. You write the following code:
penguins %>%
drop_na() %>%
group_by(species) %>%
Add the code chunk that lets you find the maximum value for the variable flipper_length_mm.
drop_na() %>%
group_by(species) %>%
Add the code chunk that lets you find the minimum value for the variable bill_depth_mm.
What is the minimum bill depth in mm for the Chinstrap species?
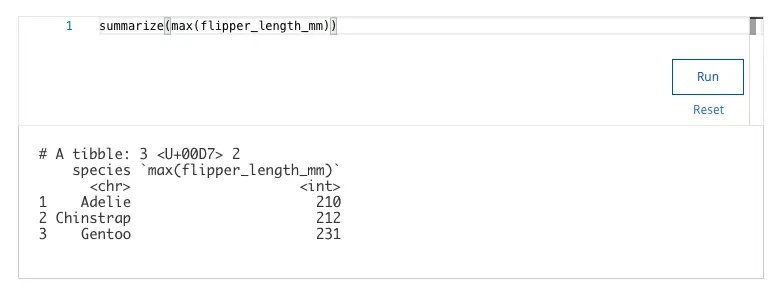
What is the maximum flipper length in mm for the Gentoo species?
- 200
- 212
- 210
- 231
7. A data analyst is working with a data frame called salary_data. They want to create a new column named total_wages that adds together data in the standard_wages and overtime_wages columns. What code chunk lets the analyst create the total_wages column?
- mutate(salary_data, standard_wages = total_wages + overtime_wages)
- mutate(salary_data, total_wages = standard_wages + overtime_wages)
- mutate(salary_data, total_wages = standard_wages * overtime_wages)
- mutate(total_wages = standard_wages + overtime_wages)
8. A data analyst is working with a data frame named stores. It has separate columns for city (city) and state (state). The analyst wants to combine the two columns into a single column named location, with the city and state separated by a comma. What code chunk lets the analyst create the location column?
- unite(stores, “location”, city, state, sep=”,”)
- unite(stores, “location”, city, sep=”,”)
- unite(stores, city, state, sep=”,”)
- unite(stores, “location”, city, state)
9. A data analyst writes the following code chunk to return a statistical summary of their dataset:
quartet %>% group_by(set) %>% summarize(mean(x), sd(x), mean(y), sd(y), cor(x, y))
Which function will return the average value of the y column?
- mean(y)
- mean(x)
- cor(x, y)
- sd(x)
10. A data analyst uses the bias() function to compare the actual outcome with the predicted outcome to determine if the model is biased. They get a score of 0.8. What does this mean?
- Bias cannot be determined
- The model is biased
- Bias can be determined
- The model is not biased
11. What is an advantage of using data frames instead of tibbles?
- Data frames allow you to create row names
- Data frames make printing easier
- Data frames allow you to use column names
- Data frames store never change variable names
12. A data analyst is examining a new dataset for the first time. They load the dataset into a data frame to learn more about it. What function(s) will allow them to review the names of all of the columns in the data frame? Select all that apply.
- colnames()
- head()
- str()
- library()
13. You are working with the ToothGrowth dataset. You want to use the skim_without_charts() function to get a comprehensive view of the dataset. Write the code chunk that will give you this view.
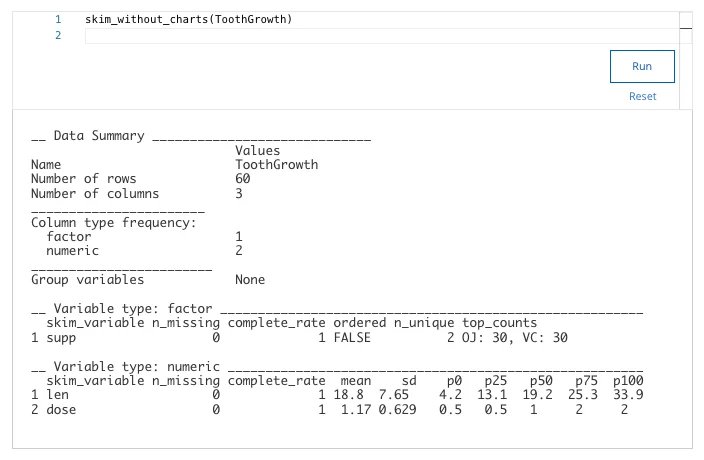
What is the average value of the len column?
- 18.8
- 13.1
- 4.2
- 7.65
14. A data analyst is working with a data frame named cars.The analyst notices that all the column names in the data frame are capitalized. What code chunk lets the analyst change all the column names to lowercase?
- rename_with(tolower, cars)
- rename_with(cars, toupper)
- rename_with(toupper, cars)
- rename_with(cars, tolower)
15. A data analyst is working with the penguins dataset and wants to sort the penguins by body_mass_g from least to greatest. When they run the following code the penguin body mass data is not displayed in the correct order.
penguins %>% arrange(body_mass_g)
head(penguins)
What can the data analyst do to fix their code?
- Save the results of arrange() to a variable that gets passed to head()
- Add a minus sign in front of body_mass_g to reverse the order
- Correct the capitalization of arrange() to Arrange()
- Use the print() function instead of the head() function
16. You are working with the penguins dataset. You want to use the summarize() and mean() functions to find the mean value for the variable body_mass_g. You write the following code:
penguins %>%
drop_na() %>%
group_by(species) %>%
Add the code chunk that lets you find the mean value for the variable body_mass_g.
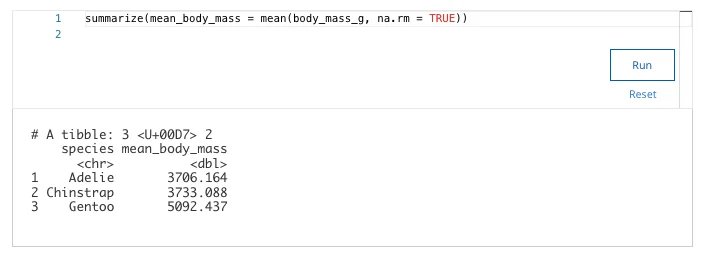
What is the mean body mass in g for the Adelie species?
- 3733.088
- 5092.437
- 3706.164
- 4207.433
17. A data analyst is working with a data frame called zoo_records. They want to create a new column named is_large_animal that signifies if an animal has a weight of more than 199 kilograms. What code chunk lets the analyst create the is_large_animal column?
- zoo_records %>% mutate(is_large_animal = weight > 199)
- zoo_records %>% mutate(weight > 199 = is_large_animal)
- zoo_records %>% mutate(is_large_animal == weight > 199)
- zoo_records %>% mutate(weight > 199 <- is_large_animal)
18. A data analyst is working with a data frame named users. It has separate columns for first name (first_name) and last name (last_name). The analyst wants to combine the two columns into a single column called full_name, with the first name and last name separated by a space. What code chunk lets the analyst create the full_namecolumn?
- unite(users, first_name, last_name, “full_name”, sep = ” “)
- unite(users, “full_name”, first_name, last_name, sep = ” “)
- merge(users, “full_name”, first_name, last_name, sep = ” “)
- unite(users, “full_name”, first_name, last_name, sep = “, “)
19. A data analyst is using statistical measures to get a better understanding of their data. What function can they use to determine how strongly related are two of the variables?
- mean()
- bias()
- sd()
- cor()
20. A data analyst wants to find out how much the predicted outcome and the actual outcome of their data model differ. What function can they use to quickly measure this?
- mean()
- bias()
- cor()
- sd()
21. A data analyst creates a data frame with data that has more than 50,000 observations in it. When they print their data frame, it slows down their console. To avoid this, they decide to switch to a tibble. Why would a tibble be more useful in this situation?
- Tibbles won’t overload the console because they automatically only print the first 10 rows of data and as many variables as will fit on the screen
- Tibbles will automatically change the names of variables to make them shorter and easier to read
- Tibbles only include a limited number of data items
- Tibbles will automatically create row names to make the data easier to read
22. A data analyst wants to learn more about a specific data frame. Which function will allow them to review the data types of each column in the data frame?
- package()
- colnames()
- library()
- str()
23. You have a data frame named employees with a column named Last_NAME. What will the name of the employees column be in the results of the function rename_with(employees, tolower)?
- last_name
- last_nAME
- lAST_nAME
- Last_NAME
24. You are working with the penguins dataset. You want to use the summarize() and min() functions to find the minimum value for the variable bill_depth_mm. You write the following code:
penguins %>%
drop_na() %>%
group_by(species) %>%
Add the code chunk that lets you find the minimum value for the variable bill_depth_mm.
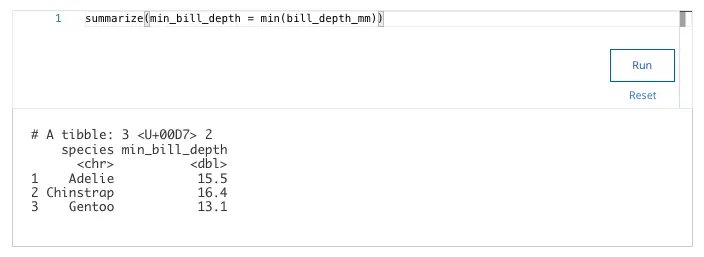
What is the minimum bill depth in mm for the Chinstrap species?
- 16.4
- 13.1
- 15.5
- 12.4
25. A data analyst is working with a data frame called salary_data. They want to create a new column named hourly_salary that includes data from the wages column divided by 40. What code chunk lets the analyst create the hourly_salarycolumn?
- mutate(salary_data, hourly_salary = wages / 40)
- mutate(salary_data, hourly_salary = wages * 40)
- mutate(hourly_salary = wages / 40)
- mutate(hourly_salary, salary_data = wages / 40)
26. In R, which statistical measure demonstrates how strong the relationship is between two variables?
- Correlation
- Maximum
- Standard deviation
- Average
27. A data analyst creates two different predictive models for the same dataset. They use the bias() function on both models. The first model has a bias of -40. The second model has a bias of 1. Which model is less biased?
- The second model
- It can’t be determined from this information
- The first model
28. What scenarios would prevent you from being able to use a tibble?
- You need to create column names
- You need to store numerical data
- You need to create row names
- You need to change the data types of inputs
29. A data analyst is working with a data frame named salary_data. They want to create a new column named wagesthat includes data from the rate column multiplied by 40. What code chunk lets the analyst create the wages column?
- mutate(salary_data, wages = rate * 40)
- mutate(salary_data, wages = rate + 40)
- mutate(wages = rate * 40)
- mutate(salary_data, rate = wages * 40)
30. A data analyst wants to check the average difference between the actual and predicted values of a model. What single function can they use to calculate this statistic?
- bias()
- cor()
- sd()
- mean()
31. A data analyst is considering using tibbles instead of basic data frames. What are some of the limitations of tibbles? Select all that apply.
- Tibbles can overload a console
- Tibbles can never change the input type of the data
- Tibbles won’t automatically change the names of variables
- Tibbles won’t automatically change the names of variables
32. A data analyst wants a high level summary of the structure of their data frame, including the column names, the number of rows and variables, and type of data within a given column. What function should they use?
- colnames()
- head()
- rename_with()
- str()
33. You are working with the ToothGrowth dataset. You want to use the glimpse() function to get a quick summary of the dataset. Write the code chunk that will give you this summary.

How many variables does the ToothGrowth dataset contain?
- 5
- 4
- 2
- 3
34. A data analyst is working with the penguins dataset in R. What code chunk will allow them to sort the penguins data by the variable bill_length_mm?
- arrange(penguins, bill_length_mm)
- arrange(bill_length_mm, penguins)
- arrange(=bill_length_mm)
- arrange(=bill_length_mm)
35. A data analyst is working with a data frame called sales. In the data frame, a column named location represents data in the format “city, state”. The analyst wants to split the city into an individual city column and state into a new countrycolumn. What code chunk lets the analyst split the location column?
- separate(sales, location, into=c(“country”, “city” ), sep=”, “)
- separate(sales, location, into=c(“city”, “country”), sep=”, “)
- untie(sales, location, into=c(“city”, “country”), sep=”, “)
- separate(sales, location, into=c(“country”, “city” ), sep=” “)
36. A data analyst is working with the penguins data. The variable species includes three penguin species: Adelie, Chinstrap, and Gentoo. The analyst wants to create a data frame that only includes the Adelie species. The analyst receives an error message when they run the following code:
penguins %>%
filter(species <- “Adelie”)
How can the analyst change the second line of code to correct the error?
- filter(Adelie == species)
- filter(“Adelie”)
- filter(“Adelie” <- species)
- filter(species == “Adelie”)
37. You are working with the penguins dataset and want to understand the year of data collection for all combinations of species, island, and sex. You write the following code:
penguins %>%
drop_na() %>%
group_by(species) %>%
summarize(min = min(year), max = max(year))
When you run the code in the code box, how many different groups are returned by this code chunk?
- 3
- 10
- 2
- 6
38. You are working with the ToothGrowth dataset. You want to use the glimpse() function to get a quick summary of the dataset. Write the code chunk that will give you this summary.
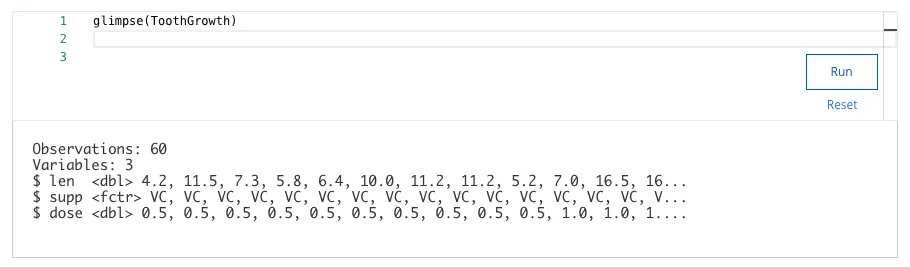
How many different data types are used for the column data types?
- 2
- 3
- 60
- 1
39. A data analyst is working with a data frame named customers. It has separate columns for area code (area_code) and phone number (phone_num). The analyst wants to combine the two columns into a single column called phone_number, with the area code and phone number separated by a hyphen. What code chunk lets the analyst create the phone_numbercolumn?
- unite(customers, “phone_number”, area_code, sep=”-”)
- unite(customers, “phone_number”, area_code, phone_num, sep=”-”)
- unite(customers, “phone_number”, area_code, phone_num)
- unite(customers, area_code, phone_num, sep=”-”)
40. You are compiling an analysis of the average monthly costs for your company. What summary statistic function should you use to calculate the average?
- mean()
- max()
- cor()
- min()
41. A data analyst is studying weather data. They write the following code chunk:
bias(actual_temp, predicted_temp)
What will this code chunk calculate?
- The average difference between the actual and predicted values
- The maximum difference between the actual and predicted values
- The total average of the values
- The minimum difference between the actual and predicted values
42. A data analyst is working with a large data frame. It contains so many columns that they don’t all fit on the screen at once. The analyst wants a quick list of all of the column names to get a better idea of what is in their data. What function should they use?
- str()
- mutate()
- head()
- colnames()
43. A data analyst is using the unite() function to combine two columns into a single column. What does the sep parameter of the unite() function represent?
- The strings to place between each column
- The vector of columns to join into the final column
- The data frame that is the target of the operation
- The name of the final column formed from the original columns
44. A data analyst is checking a script for one of their peers. They want to learn more about a specific data frame. What function(s) will allow them to see a subset of data values in the data frame? Select all that apply.
- library()
- colnames()
- head()
- str()
45. A data analyst is working with the penguins dataset. The variable island represents the island on which the sample was collected. The analyst wants to create a data frame that excludes records from the island named “Torgersen”. What code chunk will allow them to create this data frame?
- penguins %>% filter(island == “Torgersen”)
- penguins %>% filter(island = “Torgersen”)
- penguins %>% filter(island <> “Torgersen”)
- penguins %>% filter(island != “Torgersen”)